NextGCOMM MARKET INSIGHTS · 20 Oct 2026 · 7 min read
SPCX Nasdaq · Q3 FY2026 · Space, Connectivity & SI Infrastructure
01 · The headline numbers
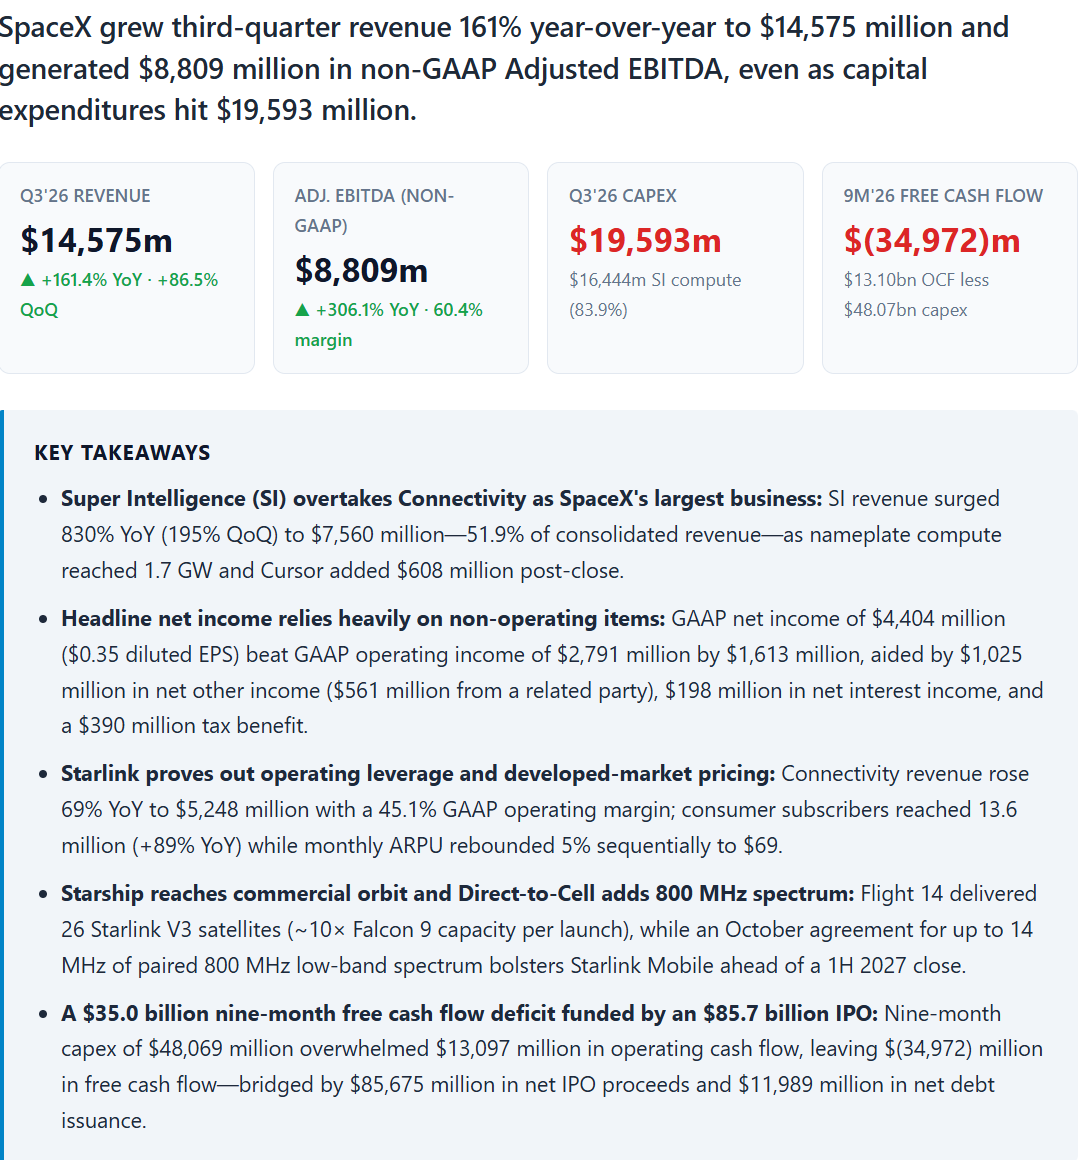
SpaceX reported third-quarter revenue of $14.58 billion, up 161% from $5.58 billion a year earlier and 87% from $7.81 billion in Q2. Income from operations was $2.79 billion, a 19.1% margin, against a $273 million loss a year ago. Net income was $4.40 billion, or $0.35 per diluted share, versus a $1.05 billion loss.
Adjusted EBITDA was $8.81 billion, a 60.4% margin, up 306%. This is a non-GAAP measure: it adds back depreciation, amortization, share-based compensation (SBC), acquisition and restructuring costs, interest, other income and taxes.
The bottom line flatters the operations. Net income exceeded operating income by $1.61 billion. Other income contributed $1.03 billion, including $561 million from an unnamed related party. Net interest income added $198 million, as $873 million earned on the IPO cash pile outran $675 million of interest expense. A $390 million tax benefit made up the rest. Roughly 37% of Q3 net income came from outside operations. For the nine months, SpaceX still lost $413 million, or $1.08 billion attributable to shareholders.
| Segment · Q3'26 · $m | Revenue | YoY | Op. income | Op. margin | Adj. EBITDA* | Capex |
|---|---|---|---|---|---|---|
| Space | 1,767 | +6.1% | (7) | −0.4% | 357 | 1,606 |
| Connectivity | 5,248 | +69.5% | 2,367 | 45.1% | 3,499 | 1,543 |
| SI | 7,560 | +829.9% | 431 | 5.7% | 4,953 | 16,444 |
| Total | 14,575 | +161.4% | 2,791 | 19.1% | 8,809 | 19,593 |
02 · Super Intelligence: the growth engine
SI, the segment formerly called "AI", generated $7.56 billion of revenue, up from $813 million a year ago and $2.56 billion in Q2. SI solutions and infrastructure drove nearly all of it, rising to $7.02 billion from $359 million. Advertising grew 18.5% to $538 million.
Cursor, acquired August 14, contributed $608 million. Assuming that revenue sits in solutions and infrastructure, the organic line was about $6.41 billion, still up 192% sequentially. New cloud services agreements, not the acquisition, explain this quarter's step-up. The release does not name those customers.
Cursor did reshape costs. SI's $431 million operating profit is after $1.22 billion of acquisition-related SBC. Excluding that charge, SI earned $1.65 billion, a 21.8% margin. The charge will recur: the equity awards tied to post-acquisition service are valued at $23.4 billion, and no vesting schedule is given. SI Segment Adjusted EBITDA (non-GAAP) was $4.95 billion.
Nameplate compute, meaning the rated power capacity of SpaceX's data-center fleet (the release does not define it precisely), reached 1.7 GW, up from 1.4 GW in June and 0.6 GW a year ago.
03 · Starlink / Connectivity: the cash engine
Connectivity revenue rose 69% to $5.25 billion, and operating income rose 99% to $2.37 billion. The operating margin reached 45.1%, up from 38.4%. Segment Adjusted EBITDA was $3.50 billion. After $1.54 billion of capex, Connectivity cleared about $1.96 billion. It is the only segment where EBITDA exceeds capex.
Starlink consumer subscribers reached 13.6 million, up 89% YoY and 1.6 million sequentially. Pricing is moving the other way. ARPU, or average monthly revenue per user, was $69, down 17% from $83 a year ago, although it rose from $66 in Q2. Consumer revenue grew 57%, well below subscriber growth. The release does not explain the YoY decline. The subscriber metric was also renamed this quarter, and the release does not say whether prior periods were restated.
Enterprise and government revenue grew faster, up 91% to $2.13 billion, and now accounts for 41% of the segment. Starlink is on more than 3,800 aircraft. After the quarter, SpaceX agreed to acquire up to 14 MHz of paired 800 MHz spectrum for Starlink Mobile. The price was not disclosed, and closing is expected in the first half of 2027.
04 · Space and Starship
Space revenue rose 6% to $1.77 billion, even though total launches fell to 35 from 44 and customer launches fell to 12 from 15. Launch services revenue rose 13%, which implies about $94 million per customer launch, up from $67 million. The segment posted a $7 million operating loss, versus a $259 million profit a year ago, as R&D rose 44% to $1.23 billion on Starship.
Bull reading
Core launch economics are intact: before R&D, the segment earned $1.22bn, up from $1.11bn. Starship Flight 14, the first orbital flight, delivered 26 Starlink V3 satellites, roughly 10× a Falcon 9 load in downlink capacity.
Bear reading
Cadence is down, segment EBITDA fell 47% to $357m, and nine-month Space EBITDA is negative. Starbase Louisiana, with a first launch targeted for 2029, has no disclosed budget.
05 · Capex, balance sheet and cash flow
Q3 capex was $19.59 billion, 2.2 times Adjusted EBITDA, and SI accounted for $16.44 billion (84%) of it. For the nine months, operating cash flow of $13.10 billion against $48.07 billion of capex left free cash flow at −$34.97 billion. Customer prepayments, visible as a $4.92 billion rise in deferred revenue, supplied 38% of operating cash flow.
The $85.68 billion IPO and $11.99 billion of net new debt funded the gap. Quarter-end cash and marketable securities totaled $89.86 billion against $38.84 billion of debt and finance leases. That is $51.01 billion of net cash, compared with $1.85 billion at year-end. A third of the debt ($12.90 billion) is owed to related parties. Goodwill rose to $48.42 billion from $11.81 billion.
The CFO cited "maintaining a robust, investment-grade balance sheet." The release discloses no credit rating.
06 · What to watch
- Earnings mix. Whether related-party other income and tax benefits recur.
- The $671m gap. The difference between the nine-month net loss and the loss attributable to shareholders is unexplained.
- Cursor math. $42.5bn of consideration plus $23.4bn of awards is $65.9bn, against a $60bn headline value. The release does not reconcile the two.
- Dilution. 13.58bn Class A and B shares were outstanding at 30 September, against 11.94bn weighted basic shares in Q3.
- Comparability. The satellite count now includes ~400 de-orbit-approved units, and the subscriber metric was redefined.
- Cloud contracts. Customer concentration and contract duration are not disclosed.
07 · Bottom line
SpaceX now looks like three businesses with very different economics. Starlink earns cash. Space reinvests whatever it earns into Starship. SI is growing fastest and consuming the most capital. The quarter's operating inflection is genuine, but headline net income relied on non-operating items, and SI capex is running at roughly 3.3 times SI EBITDA. The IPO cash pile has bought time. The open question is whether cloud contracts convert into returns before it runs down.